In Descriptive Statistics and Data Visualization, you’ll learn to explore datasets with code and turn findings into targeted visuals that drive clear decisions. This is a skill-based path organized around real analyst job tasks. You’ll start with a quick check of what you already know, then focus on the skills you want to strengthen. Skip topics you’ve mastered and dive deeper where you need practice. Each lesson is curated from expert instructors so every step builds a concrete workplace skill.
Using Python (pandas, seaborn/matplotlib), you’ll perform exploratory data analysis (EDA), compute and interpret measures of central tendency and dispersion, summarize categorical variables with frequency analysis, and create exploratory charts. In Tableau, you’ll identify the right chart for a question and build comparison visuals that stack KPIs against targets and across business segments. By the end, you can explore data reproducibly, summarize results clearly, and design targeted visuals including skills that map to responsibilities in roles like Data Analyst, Business Intelligence Analyst, Reporting Analyst, and Operations Analyst.
Advantages and disadvantages
Advantages
Structured courses with graded quizzes, assignments and deadlines you can reset.
A shareable certificate from the university or company when you pay.
Financial aid is often approved for students in India (apply 15 days before you need it).
Self-paced: start any time.
Disadvantages
Paid after a 7-day free trial (Coursera Plus or per course).
Some courses can be audited for free, but graded work and certificates need payment.
Some points apply to every course of this kind; see how we rank.
This course is paid. Here is how to take it for free
Free trials: You can start a 7-day free trial for many individual courses, Specializations, or a Coursera Plus subscription to test full course features. Cancel before the seventh day if you do not want to be charged.
Financial aid: If you cannot afford the fee for a certificate, you can apply for financial aid through the link on the course home page by filling out an application about your background and goals.
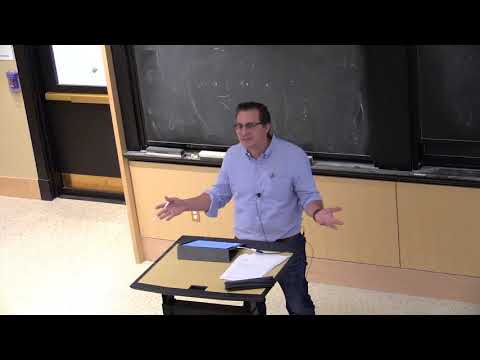
MIT 18.650 Statistics for Applications, Fall 2016 View the complete course: http://ocw.mit.edu/18-650F16 Instructor: Philippe Rigollet This course offers an in-depth the theoretical foundations for statistical methods that are useful in many applications. The goal is to understand the role of mathe…
This is an introductory-level course in supervised learning, with a focus on regression and classification methods. The syllabus includes: linear and polynomial regression, logistic regression and linear discriminant analysis; cross-validation and the bootstrap, model selection and regularization m…
This is an introductory-level course in supervised learning, with a focus on regression and classification methods. The syllabus includes: linear and polynomial regression, logistic regression and linear discriminant analysis; cross-validation and the bootstrap, model selection and regularization m…