
technifyedWeekly list

Google Cloud

Looker Studio Essentials

via edX

Overview

This course provides an introduction to Looker Studio’s powerful features for data visualization and reporting. Learn to transform raw data into insightful reports by mastering various visualization options, connecting to diverse data sources, and implementing interactive controls such as filters. Explore data blending techniques to combine information from multiple sources and unlock deeper insights. Through hands-on exercises you'll gain the skills to create compelling, dynamic reports that...

What you'll learn

  • Recognize key concepts and features in Looker Studio, including the interface, data connections and basic visualizations.
  • Describe the main data visualization charts and build simple reports using common chart types and data sources.
  • Describe the differences between types of data sources and connect to data sources using connectors.
  • Use data blending techniques to combine data from multiple sources.
  • Apply basic interactivity through filters to explore data dynamically.

Skills you'll practise

Looker AnalyticsData VisualizationData Blending

Advantages and disadvantages

Advantages

  • University courses you can audit for free, with lectures, readings and practice quizzes.
  • A verified certificate from the university if you pay for it.
  • From Google, a well-regarded name.
  • Self-paced: start any time.

Disadvantages

  • Graded assignments and the certificate need the paid track.
  • Audit access can expire a few weeks after the course ends.
  • Learning is free, but the certificate costs money.
  • Some parts (graded work, certificate) are paid.

Some points apply to every course of this kind; see how we rank.

Free to audit

  • Free: Choose "Audit this course" when you enrol: lectures, readings and practice are free.
  • Paid: Graded assignments and the verified certificate (Certificate $20). Audit access may end after the course closes.

Google is in Tier 2: excellent universities and the companies that build the technology of our institution ranking (88/100). They build what they teach.

Similar courses

Compare these

Massachusetts Institute of Technology

MIT 18.650 Statistics for Applications, Fall 2016

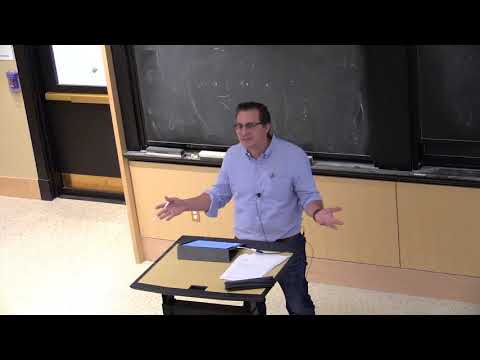
MIT 18.650 Statistics for Applications, Fall 2016 View the complete course: http://ocw.mit.edu/18-650F16 Instructor: Philippe Rigollet This course offers an in-depth the theoretical foundations for statistical methods that are useful in many applications. The goal is to understand the role of mathe…

  • Free video
  • 22 videos, 28 hours

Harvard University

Introduction to Data Science with Python

4.3174 ratings

Learn the concepts and techniques that make up the foundation of data science and machine learning.

  • Free to audit
  • 8 weeks, 3 - 5 hours per week

Stanford University

Statistical Learning with Python

This is an introductory-level course in supervised learning, with a focus on regression and classification methods. The syllabus includes: linear and polynomial regression, logistic regression and linear discriminant analysis; cross-validation and the bootstrap, model selection and regularization m…

  • Free video
  • 108 videos, 20 hours

Stanford University

Statistical Learning with R

This is an introductory-level course in supervised learning, with a focus on regression and classification methods. The syllabus includes: linear and polynomial regression, logistic regression and linear discriminant analysis; cross-validation and the bootstrap, model selection and regularization m…

  • Free video
  • 104 videos, 20 hours

Harvard University

Data Science: R Basics

4.4273 ratings

Build a foundation in R and learn how to wrangle, analyze, and visualize data.

  • Free to audit
  • 8 weeks, 2 - 3 hours per week

Harvard University

Data Science: Visualization

4.4122 ratings

Learn basic data visualization principles and how to apply them using ggplot2.

  • Free to audit
  • 8 weeks, 2 - 3 hours per week