 Microsoft
Create Real-Time Dashboards with Microsoft Fabric
Real-Time Dashboard is a capability in Microsoft Fabric that you can use to create interactive data visualizations.
- Microsoft Learn
- 1 hour
- Self-paced
- Free course
- Free badge
- Beginner
Free online
Learn Interactive Data Visualization online: university courses, full YouTube courses, and courses with free certificates, from the IITs, MIT, Harvard, Google, Microsoft and more.
Microsoft
Real-Time Dashboard is a capability in Microsoft Fabric that you can use to create interactive data visualizations.
 Johns Hopkins University
Data visualization is a critical skill for anyone that routinely using quantitative data in his or her work - which is to say that data visualization is a tool that almost every worker needs today. One of the critical tools for data visualization today is the R statistical programming language. Esp…

Learn how to create responsive, animated, interactive charts using Svelte and D3.js from @ever-greg Follow along in your browser here: https://svelte.dev/playground/hello-world?version=5.34.5 Completed code: https://svelte.dev/playground/20adb7678797430185a61dbb47fce3f9?version=5.36.4 Thanks to @Le…
 SAS
In this course, you learn about the data structure needed for geographic mapping and forecasting, how to use SAS Data Studio to restructure data for analysis, and how to create geo maps and forecasts in SAS Visual Analytics.
 Macquarie University
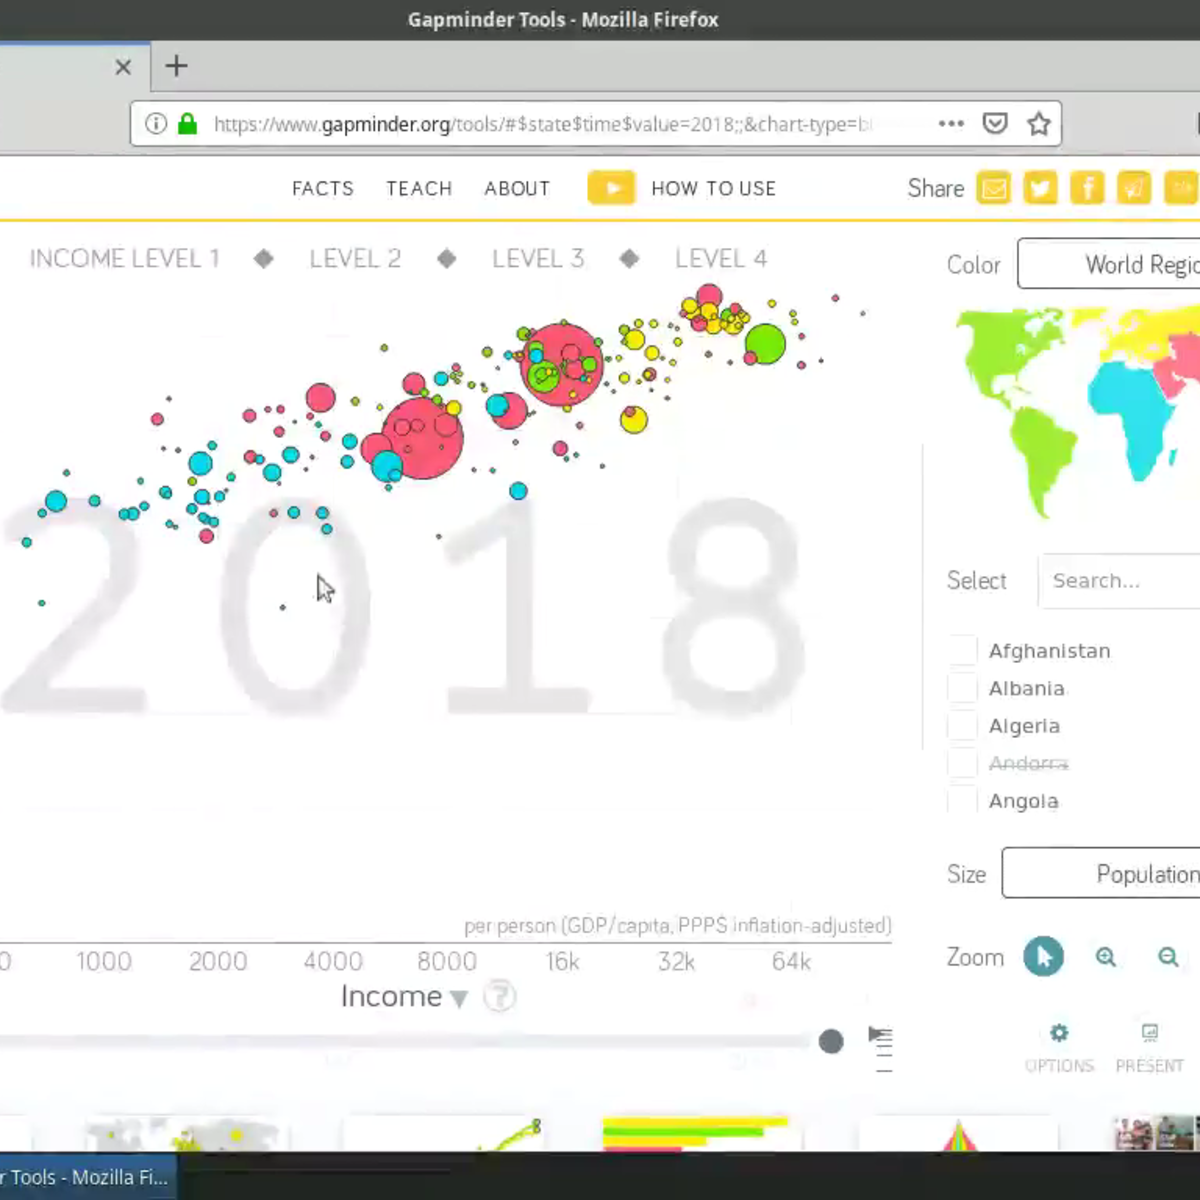
In an age now driven by "big data", we need to cut through the noise and present key information in a way that can be quickly consumed and acted upon making data visualization an increasingly important skill. Visualizations need to not only present data in an easy to understand and attractive way,…
 Coursera
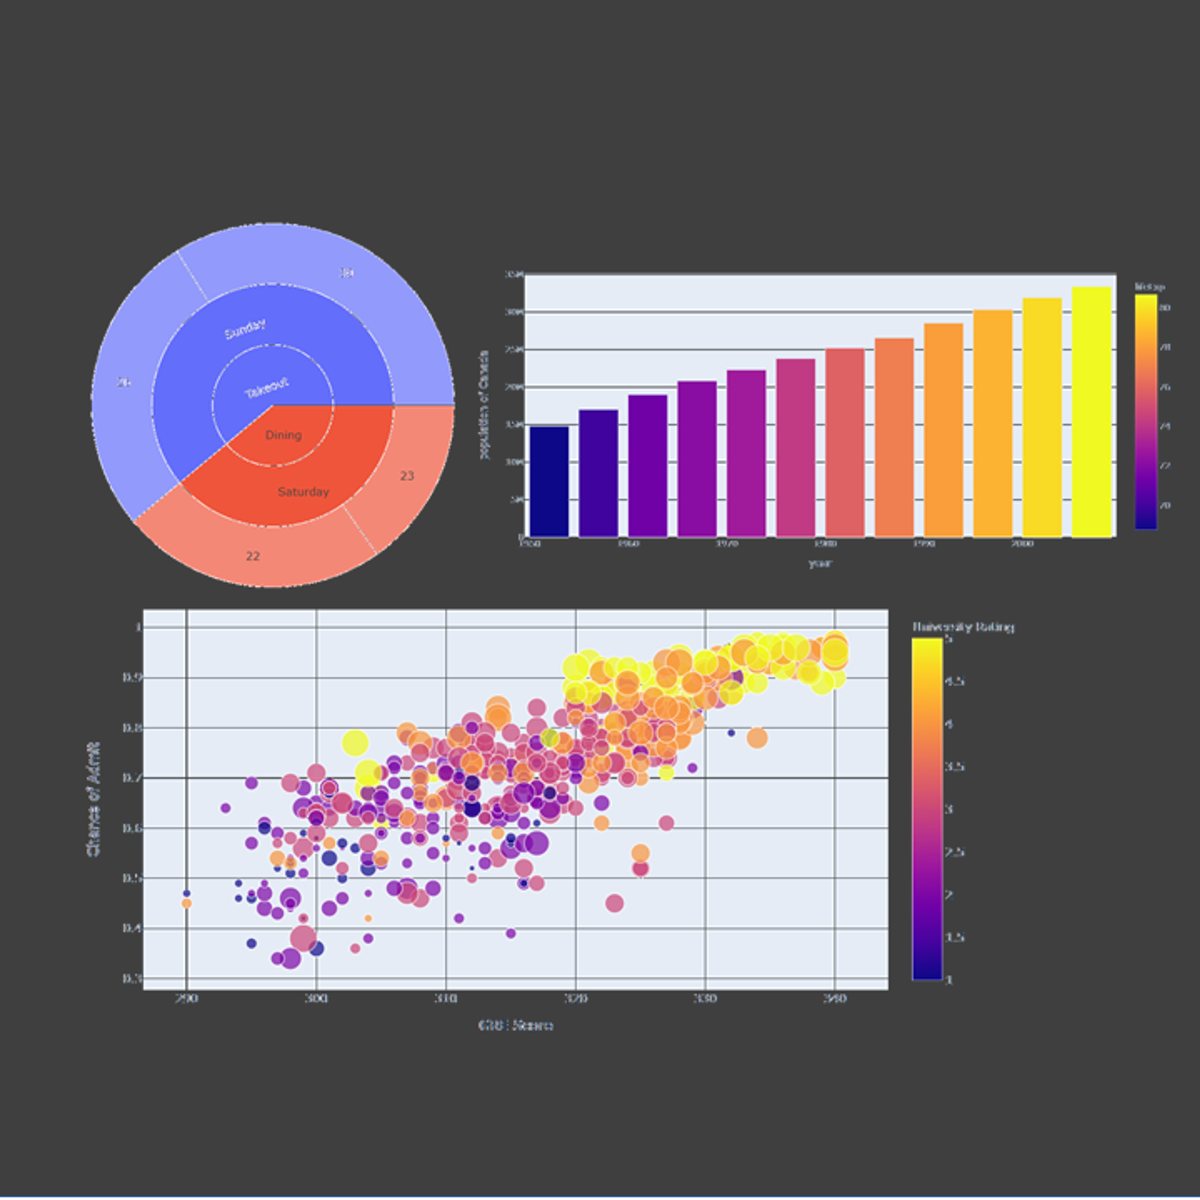
Welcome to this project-based course on Data Visualization with Plotly Express. In this project, you will create quick and interactive data visualizations with Plotly Express: a high-level data visualization library in Python inspired by Seaborn and ggplot2. You will explore the various features of…
Coursera
In this hands-on project, we will understand the fundamentals of interactive data visualization using Plolty Express. Plotly Express is a powerful Python package that empowers anyone to create, manipulate and render graphical figures with very few lines of code. Plotly Express is the recommended en…
Coursera
This Guided Project, Introduction to D3.js is for those who want to learn about D3.js which is a JavaScript library for producing SVG-based, dynamic, interactive data visualizations in web browsers. In this 2-hour-long project-based course, you will get to know different SVG elements, build SVG-bas…
 EDUCBA
Learners will build foundational skills to design, develop, and deploy interactive data visualization applications using R Shiny. By completing this course, learners will be able to explain the core architecture of Shiny applications, construct user interfaces with inputs and layout elements, and i…